Splunk’s Search Processing Language (SPL) is a powerful tool for analyzing and visualizing data, offering an array of commands to extract meaningful insights. In this post, I’ll walk through some basic search commands using SPL to familiarize myself, and you, with its capabilities. If you’re new to Splunk, I highly recommend exploring their excellent training resources available here. These courses are organized into various tracks aligned with Splunk certifications. While this post won’t replace formal training, it will provide a practical introduction to working with Splunk Search.
Preparing to Work with Data
Before diving into search commands, I needed a dataset to analyze. After some research, I found several public data repositories, including:
I chose the US Candy Distributor dataset from Maven Analytics (download link). It’s a rich dataset with geospatial information, making it ideal for exploring Splunk’s mapping features. After extracting the ZIP file, I found six CSV files, two images, and some macOS system files.
Adding Data to Splunk
To begin, I uploaded the Candy_Sales.csv file into Splunk. If you’re following along, here’s how to do it:
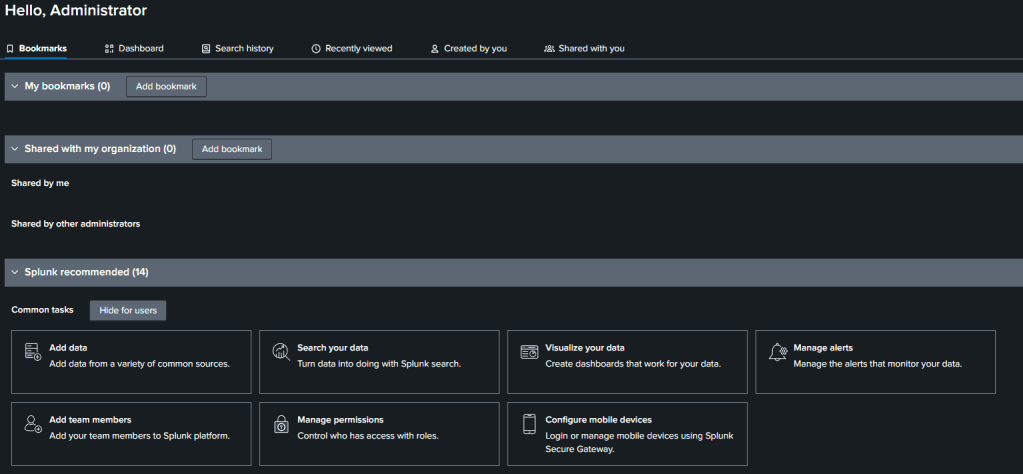
- From the Splunk home screen, click Add Data under the “Bookmarks” section.
- Select Upload

- Drag the
Candy_Sales.csvfile into the uploader or use the file browser to select it, then click Next.

- On the Set Source Type page, leave the settings at their defaults and proceed.
- On the Input Settings page:
- For Host, input
candy_sales. - For Index, click Create a new index, name it
us_candy, and select it from the dropdown.
- For Host, input

After uploading, you can run a quick search to verify the data is indexed correctly.
Adding a Lookup Table
To enhance analysis, I added a lookup table for geographic information using the uszips.csv file from the dataset:
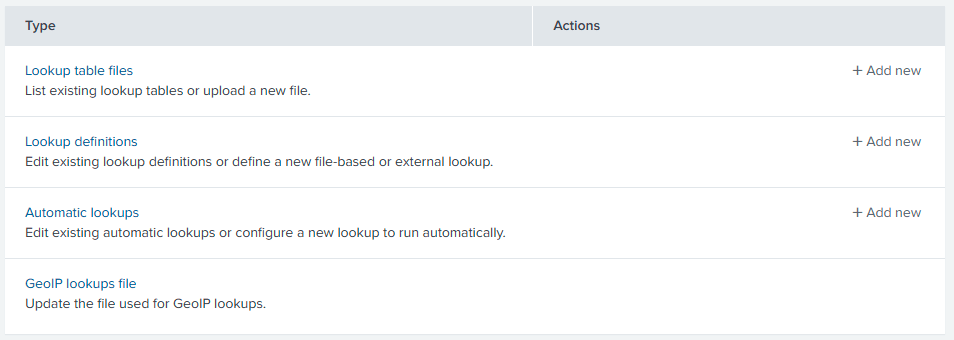
- Navigate to Settings > Select Lookups under the Knowledge Heading

- Select + Add new under Lookup table files.
- Choose the
uszips.csvfile and save it with the nameuszips.csv.

- Next, create a lookup definition:
- Go to Settings > Lookups and select + Add new under Lookup definitions.
- Name it
zip_code_lookupand associate it with theuszips.csvfile.

Exploring SPL: Basic Search Commands
With data in place, I started testing Splunk’s search features. Here’s an example:
Checking the Dataset
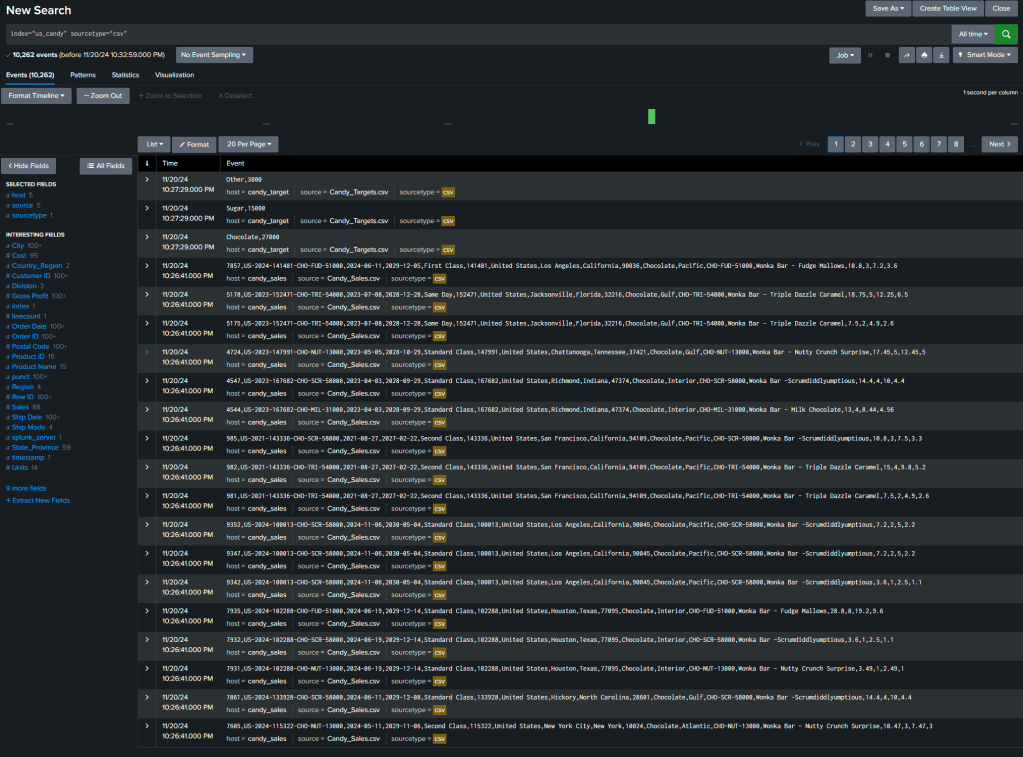
To ensure the data loaded correctly, I ran the following search:
index="us_candy" sourcetype="csv"
This returned 10,262 events from the Candy_Sales.csv file.
Working with Fields
Fields in Splunk function as column titles and can hold unique values for each event. Default fields like host, source, and sourcetype appear for all searches, while interesting fields—present in at least 20% of events—are listed on the sidebar. For instance, clicking the field City displayed the most common values, and selecting “New York City” filtered the results to:
index="us_candy" sourcetype="csv" City="New York City"

A few key points about fields:
- Field names are case-sensitive.
- Values are not case-sensitive.
- You can use
=and!=for string/numeric values, and comparison operators (>,>=,<,<=) for numeric values.
Here are some sample queries:
- All events where the city is not New York City:
index="us_candy" sourcetype="csv" City!="New York City"
- Events with
Gross Profitgreater than 4.22:
index="us_candy" sourcetype="csv" "Gross Profit">"4.22"
- Cities starting with “San” (e.g., San Diego):
index="us_candy" sourcetype="csv" City="San*"
Visualization with SPL
Splunk’s visualization tools bring data to life. Here’s a search to chart profits by product and city:
index="us_candy" source="Candy_Sales.csv"
| rename "Product Name" as prod_name "Gross Profit" as profit
| fields City prod_name profit
| chart sum(profit) over prod_name by City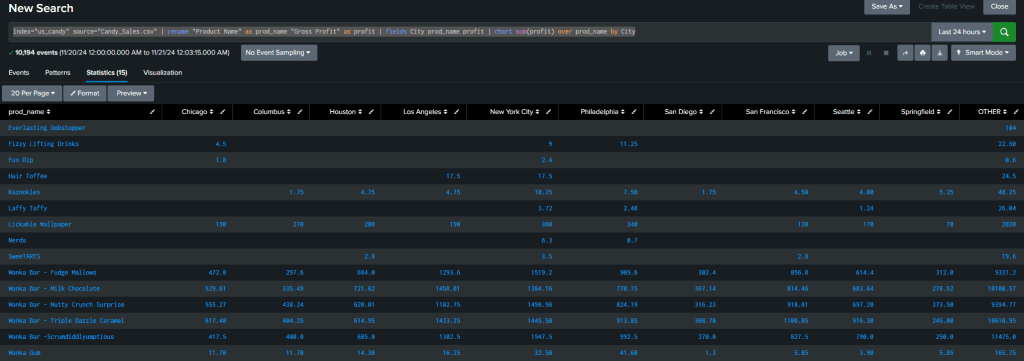
This command generates a column chart by default. Select Visualization to view the data in chart form.
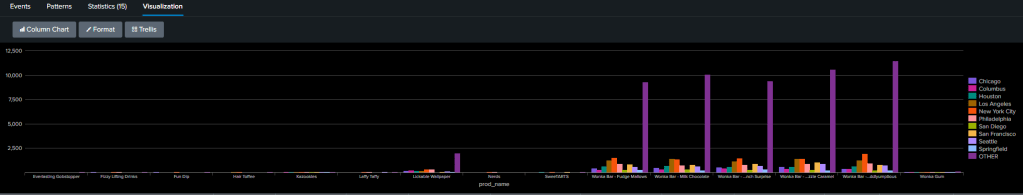
In this view, we noticed the “Other” group, made up of aggregated smaller cities, overshadows the other data. By refining the query, we excluded the “Other” group:
index="us_candy" source="Candy_Sales.csv"
| rename "Product Name" as prod_name "Gross Profit" as profit
| fields City prod_name profit
| chart sum(profit) over prod_name by City
| fields - OTHER
This data is more easily read, but does remove some of the data, so it really depends on what information you are trying to understand.
Mapping Geographic Data
Next, I created a cluster map of sales data using the zip_code_lookup table. This query correlates sales data with geographic locations:
index="us_candy" source="Candy_Sales.csv"
| rename "Postal Code" as zip
| lookup zip_code_lookup zip AS zip OUTPUTNEW lat AS lat lng AS long
| fields zip Sales lat long
| geostats latfield=lat longfield=long count by Sales
Switching to the Cluster Map visualization, Splunk displayed pie charts for each location. Adjusting the query to show total sales per location provided a more actionable map.
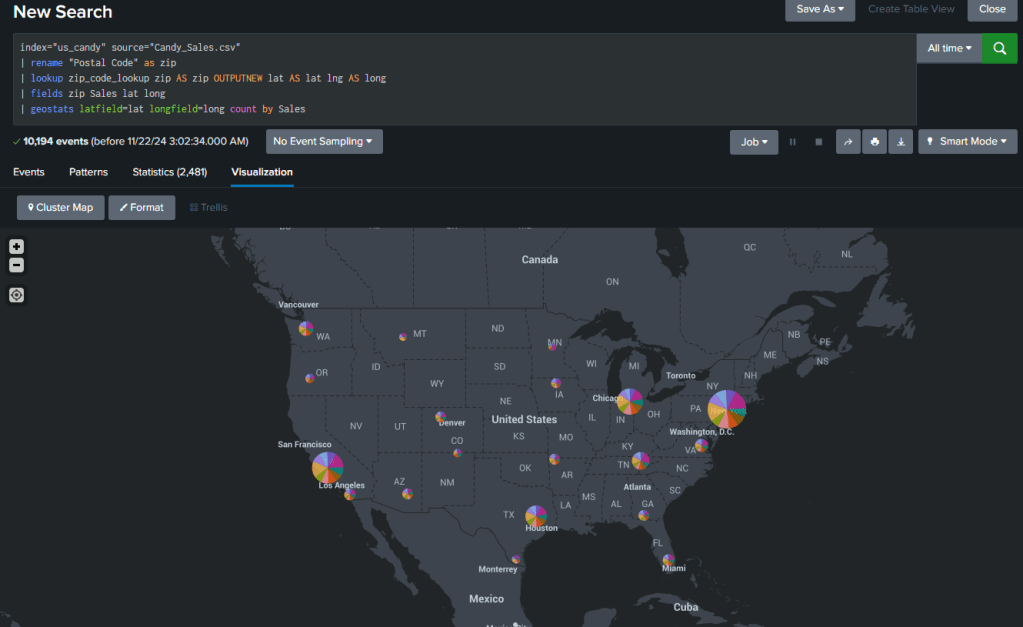
This search gives us the individual sales by zipcode. The changed code below gives us total sales by zipcode.
index="us_candy" source="Candy_Sales.csv"
| rename "Postal Code" as zip
| lookup zip_code_lookup zip AS zip OUTPUTNEW lat AS lat lng AS long
| fields zip Sales lat long
| geostats latfield=lat longfield=long sum(Sales) by zip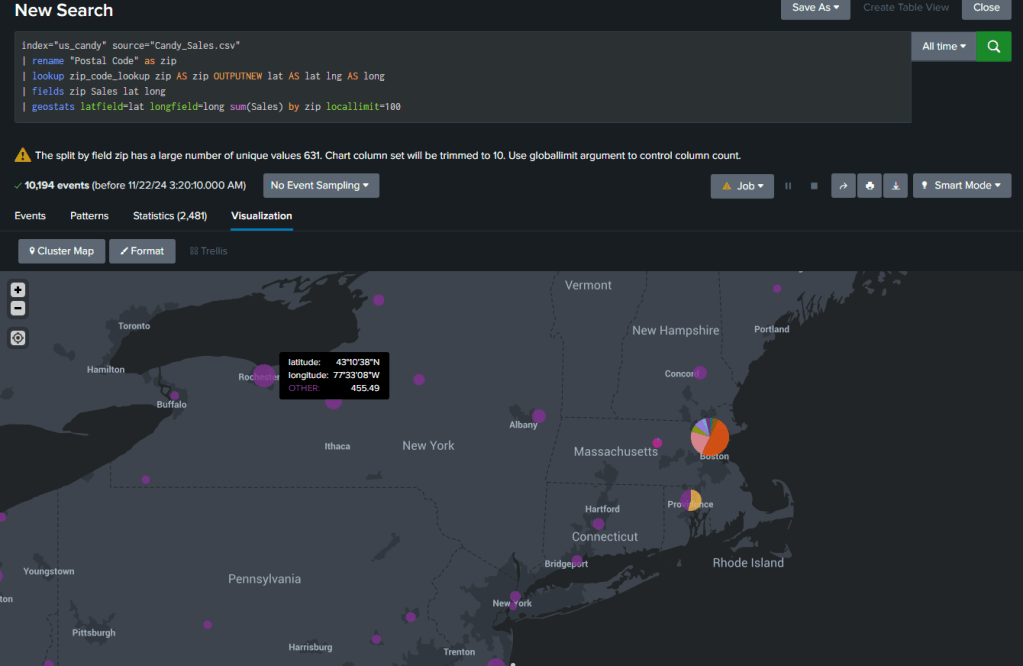
This view shows us an issue with our location data because the several zip codes in Boston all share the same Latitude and Longitude. The data from total sales for each zip code is still available by hovering over the pie chart.
Pivot Chart
Splunk’s Pivot feature offers a more visual, point-and-click method to explore your data, ideal for users who may not yet be comfortable writing SPL queries.
- After running a new search, navigate to the Statistics or Visualization tab.
- Select the Pivot option.
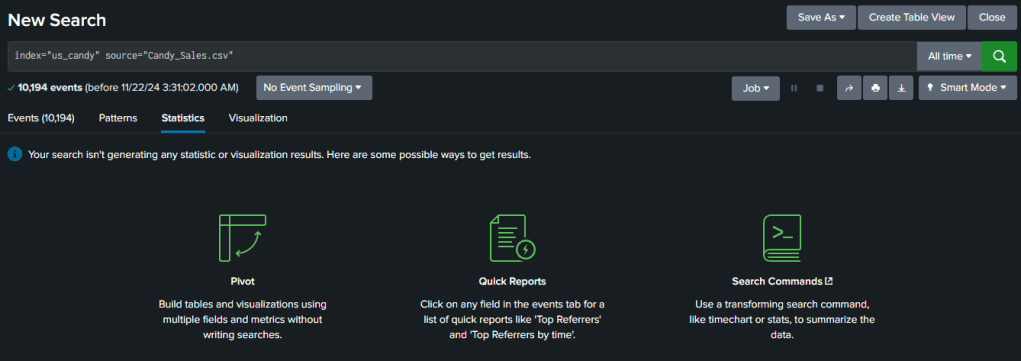
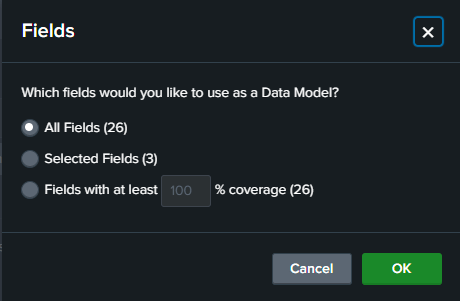
- Choose the fields you want to include in your pivot table.
- Tip: Narrow down the fields through your original search query before this step to avoid overloading the pivot table, especially with large datasets. In this example, I used all fields to demonstrate the capability, but this is not recommended for more extensive data.
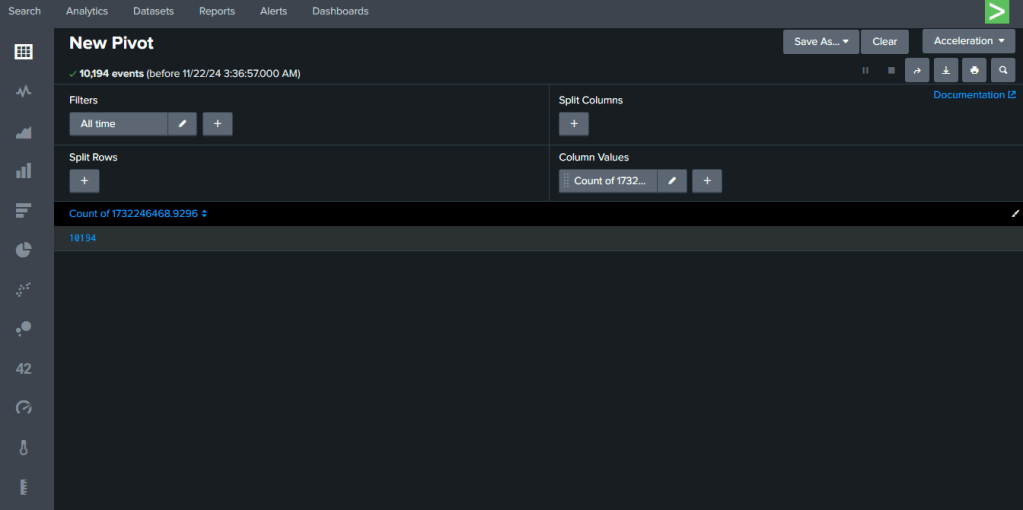
Once on the Pivot page:
- You can interactively explore the data by selecting fields, grouping data, and applying filters or aggregations.
- This method is user-friendly and doesn’t require prior SPL knowledge, making it an excellent option for newcomers to Splunk.
SPLUNK Security Essentials (SSE) Line-By-Line
Another way to deepen your understanding of SPL and discover pre-built searches is through the Splunk Security Essentials (SSE) app. This free app, available on Splunkbase, is a powerful resource for exploring Splunk’s search capabilities, particularly in the context of security use cases.
How to Install SSE:
- Navigate to Apps in the Splunk interface, then click Find More Apps from the dropdown menu.

- Search for Security Essentials in the App Browser.
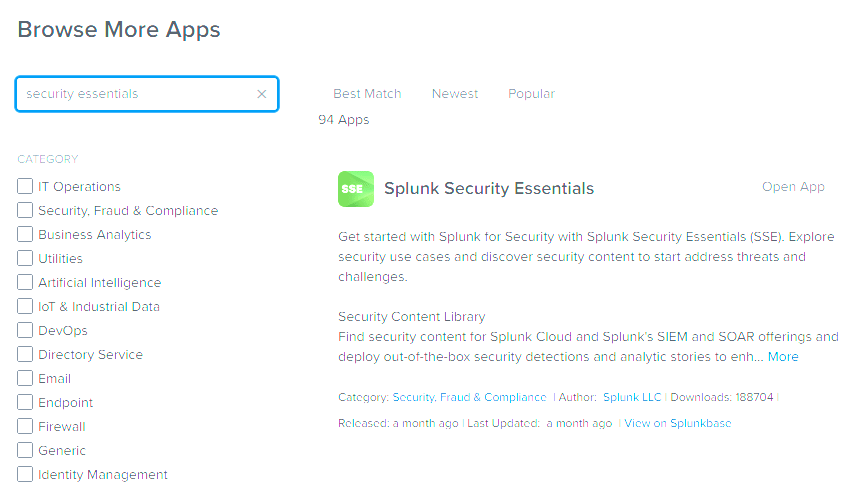
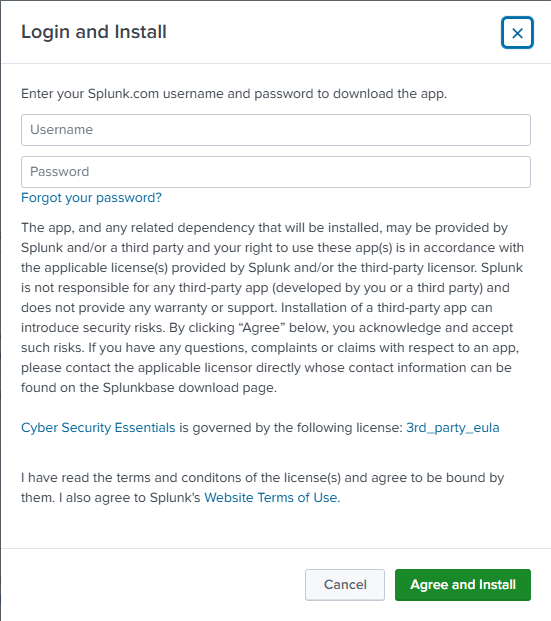
- Select Install (if not already installed).
- Note: You will need your Splunk.com account credentials (not your Splunk instance credentials) to complete the installation.
Using SSE for Search Examples:
- Open the SSE app.
- Select Find Content from the app’s menu.
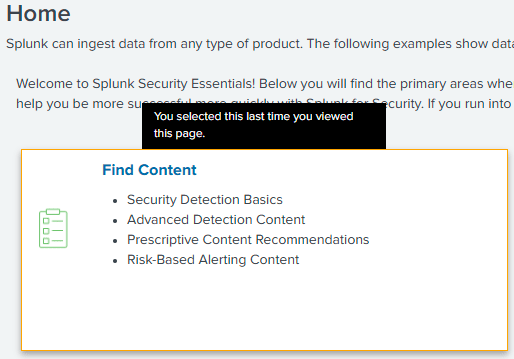
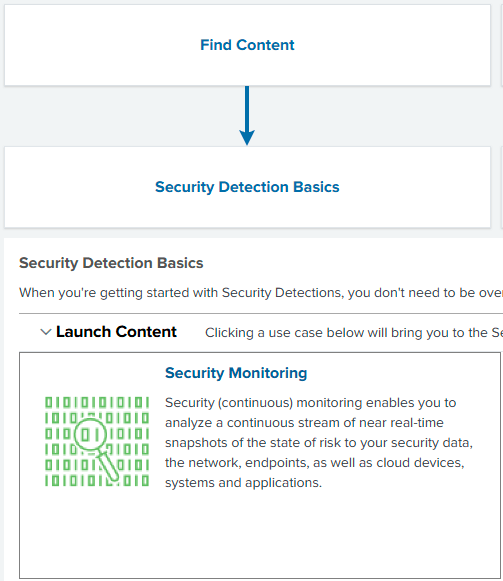
- Choose a category based on your interest. For this example:
- Click Security Detection Basics > Security Monitoring.
- Use the search bar to locate content that aligns with your goals. For instance:
- Search for local admin.
- Select the Detect New Local Admin Account example.
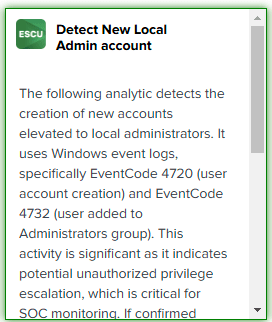
On the content page:
- You’ll find detailed explanations of the detection, its relevance, and the SPL commands required to implement the search.
- Scroll to the “Detect New Local Admin Account” section to see the specific SPL query.
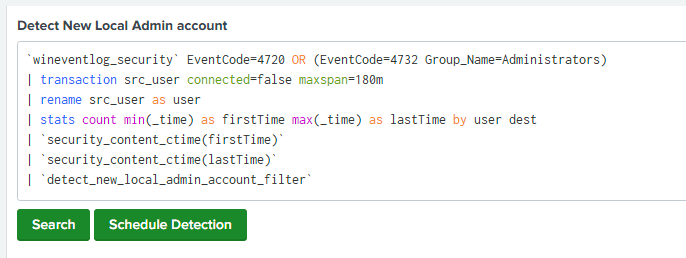
- These pre-built examples are invaluable for learning advanced SPL commands and building searches tailored to your environment.
Further Learning:
Splunk provides a dedicated training course on the SSE app, which I highly recommend for understanding its full range of capabilities. Exploring SSE is a fantastic way to discover new search ideas, improve your SPL proficiency, and get inspired by real-world use cases.
Conclusion
Exploring Splunk’s Search Processing Language is an essential step toward mastering data analysis and visualization. The exercises in this post barely scratch the surface of SPL’s capabilities, but they offer a hands-on introduction to its potential. Whether you’re analyzing candy sales or enterprise-level logs, SPL is an invaluable tool for uncovering insights.
For deeper learning, check out Splunk’s training resources. Let me know in the comments what SPL features or commands you’d like me to cover next!


Leave a comment